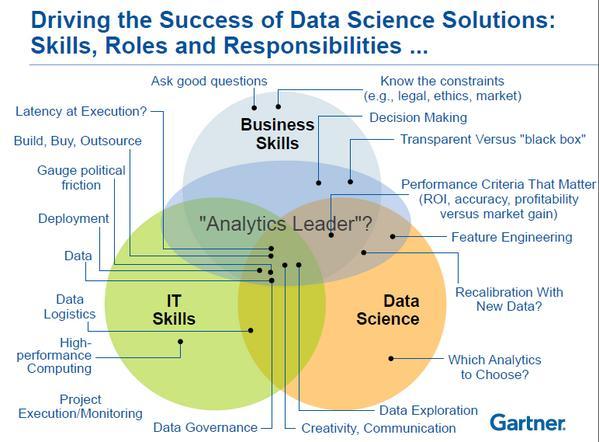
Building effective analytics requires interdisciplinary knowledge and skills. It can go beyond understanding context of problem, gathering/cleaning data, feature engineering, training/testing a model and making solutions available (though critical). Understanding when to buy, build, or outsource a solution is essential to innovating, scaling, and sustaining data products. Let’s walk through the full-stack of skills and considerations to enable effective analytical environment.
First let’s baseline – as the data science field matures different types of data scientist skills, roles, and responsibilities will emerge (fun note here on “battle of the Data Science Venn Diagrams…let’s not take ourselves to seriously). Being a “Analytical leader” tasked to deploy effective data products will require deep context of why, when, where, and how data will help achieve desired outcomes.

At a glance this may be overwhelming, but read this as a team roster not ones resume. Let’s start with 4 major skills and add details as we go.
Establish a Vision and Strategy for Organization, Community, or Platform.
- Start with Why? Set a vision that is clear, compelling, codifying, and complete – this will inspire all types of people.
- Translate the vision into a strategy which guides the “What are we going to do?” questions.
- Be clear on vision and strategies purposes – “to inspire and give purpose”. This is not the “HOW?” part.
Define a relevant problem or opportunity.
- Ask targeted questions, define problem, impact, and urgency. Form problem statement
- Understand end-user, supporting process, and desired outcome.
- Analyze data within context of user, process, and outcome (think – exploratory data analysis).
- Visualize data and tell a story that matters (including impact to business metrics and real outcomes that are well understood)
Critical Thinking Frameworks to Problem Solve
- First Principles – Break down complex problems into basic elements and create innovative solutions from there.
- Issue Trees – structure and solve problem in a systemic way with map of problems.
- Abstraction Laddering – Frame your problem better with different levels of abstraction.
- Inversion Thinking – Approach a problem from a different point of view. e.g. Am I think of ideal solutions or scenarios? How could an obvious solution be bad?
- Productive Thinking – Solve problems creatively and efficiently with 6 questions.
- Conflict Resolution Diagram – Find win-win solutions to conflicts.
- Ishikawa Diagram (Fishbone) – find root causes to problem.
Understanding and Conceptualizing Complex Systems
- Concept Maps – Understand relationships between entities in a concept or system.
- Connection Circles – Understand relationships and identify feedback loops within systems.
- Value Stream Mapping – identify waste, reduce process cycle times, and implement process improvement.
- SIPOC Flow – identifies the inputs, process, and outputs respecting supplier and consumer of value.
- Integration Process Mapping with Data, Tools, and Control Points – end to end mapping of not just process flow but when, where, and how data and tools are used to influence decisions.
- Data Flow Diagram – visual flow of process steps overlayed with information gained and data captured, and checks on assessing value along the way.
Assess when to build, buy, or outsource analytical solutions, find unique value.
- Do we have access to data? Do we trust data? Can we govern data? Does data change often?
- What’s the required latency of data to support decision-making frequencies (think – velocity of decisions, speed of process)
- Does current data infrastructure support volume and variety of data to meet latency requirements? Whats the cost to get there and maintain it?
- Do we have right skills and resources to support solutions across life-cycle (e.g. definition, develop, deploy, maintain, and evolve)? All very different skills.
- What do other teams, vendors, and/or products do well already? Can we do it better?
Be hands-on – establish ability to quickly build, test, fail, iterate, and deploy usable solutions
- Do we have the right data and analytics workbench that enables analytics solution life-cycle?
- Are these workbench environments cost effective as they change with new technology (e.g. consider open-source stack)
- Are these workbench environments scale-able, configurable, supportable, and portable?
- Do you have people who can learn quickly and demonstrate solution within context of business problem? Actual workable solutions?
Ensure analytical solutions are effective.
- Are users or operators aware of solutions and potential impact?
- Are they actually using it and getting desired outcome?
- Are users providing feedback on how to improve solution and are improvements being made?
- Assess total cost of solution ownership (includes data platform, support, storage, micro-services, enhancements to remain competitive).
- Is solution effective for users and economical to maintain and evolve (giving strategic advantage)?
‘Must-Have’ Technical Skills
- Acquiring Data (Python, SQL, APIs, web-scrapping, spreadsheets)
- Storing Data (databases, data ingestion methods)
- Transforming Data (Python and SQL)
- Extract Insights (Hypothesis Testing, ANOVA, Anomaly Detection, Optimization, etc)
- Automating Tasks (Python, Task Schedulers, Alerts)
- Applying Machine Learning (use-cases, purpose, pros/cons, limitations)
- Selecting best visualization (fit for use)
- Harnessing cloud resources (containerization, virtual machines, AWS, GCP, Docker)
Useful Analytics Techniques and Concepts
- Forecasting
- Classification
- Anomaly Detection
- Linear Programming
- Stochastic Programming
- Decision Trees
- Modern Portfolio Theory
- Expected Value
- Fitting Distribution
- Probability Density Functions (PDF)
- Cumulative Distribution Function (CDF)
- Mean, Variance, Standard Deviation, Coefficient of Variation (CV)
- Exploratory Data Analysis (EDA)